Floor & Decor: Beware Of The Bull Trap (Technical Analysis) (NYSE:FND)

SERSOL
Introduction
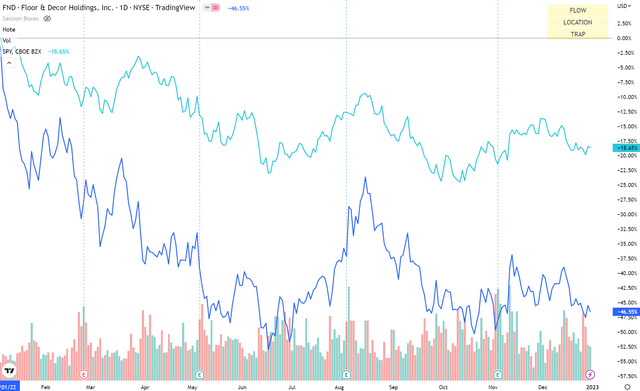
FND vs S&P500 Performance (TradingView, Author’s Analysis)
Home improvement retailer Floor & Decor Holdings (NYSE:FND) has underperformed the S&P500 (SPY) (SPX) by 27.9{a57a8b399caa4911091be19c47013a92763fdea5dcb0fe03ef6810df8f2f239d} in 2022. Yet, Seeking Alpha analysts have broadly been bullish on the stock:
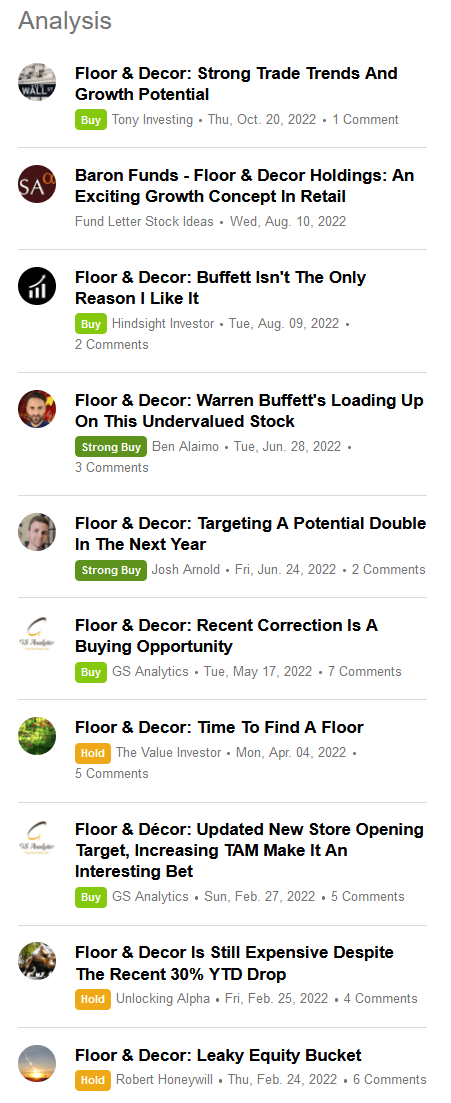
Seeking Alpha Authors’ Ratings on FND (Seeking Alpha)
As of late, some authors have cited growth in traffic as a key driver for bullish views. However, my research shows otherwise. Demand is slowing down and I think there is a risk of FND missing growth estimates for Q4 FY22.
Thesis Summary
I am bearish FND due to 3 key reasons:
- Sharp fall in site visits suggests sluggish demand
- Existing home sales activity has been weak in Q4 FY22
- Degree of bullish beats on revenue is declining
Sharp fall in site visits suggests sluggish demand

Site Visits to FloorAndDecor.com (Similar Web, Author’s Analysis)
As can be seen in the chart above, Q4 FY22 has seen a sharp decline in total site visits. Latest data as of the November 2022 print shows a 2{a57a8b399caa4911091be19c47013a92763fdea5dcb0fe03ef6810df8f2f239d} fall in site visits on a YoY basis as well, which indicates weakness after accounting for seasonality effects:
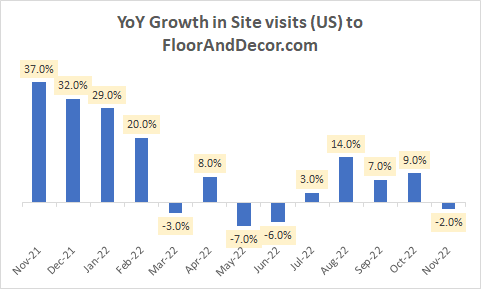
YoY Growth in Site Visits (US) to FloorAndDecor.com (Similar Web, Author’s Analysis)
This poses risks to top-line growth in the final quarter of CY22. A key driver of this decline is a slowdown in the existing home sales, which is the underlying demand driver for FND’s flooring business:
Existing home sales growth continues to be weak
Available data for CY22 shows continuous QoQ declines in US existing homes sales:
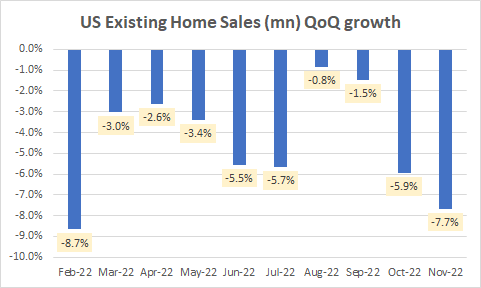
US Existing Home Sales QoQ growth (Trading Economics, Author’s View)
As can be seen in the chart above, in October 2022 and November 2022, the sequential declines accelerated. Now one may argue that sharper declines in the cooler autumn months is normal and part of seasonality patterns for FND. However, longer term data also shows a 35.4{a57a8b399caa4911091be19c47013a92763fdea5dcb0fe03ef6810df8f2f239d} decline on a YoY basis as well:
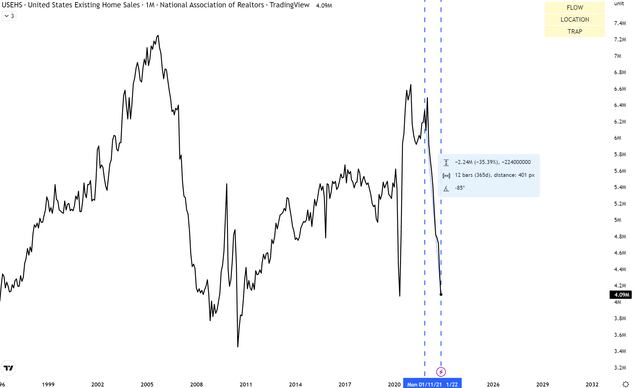
Longer Term US Existing Home Sales Data (Trading View, National Association of Realtors, Author’s View)
In the chart above, it is clearly apparent that 2022 has seen a much steeper fall than in previous years. This is another indicator of weak volume demand for FND.
Degree of bullish beats on revenue is declining
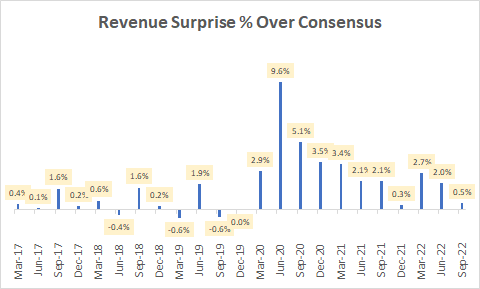
Revenue Surprise {a57a8b399caa4911091be19c47013a92763fdea5dcb0fe03ef6810df8f2f239d} Over Consensus (Capital IQ, Author’s Analysis)
FND has been consistently defying analysts’ expectations on revenue growth for a large part of 2020 and 2021 and the first half year of 2022. However, the latest September 2022 quarterly print shows a sharp decline in the surprise over consensus. Combined with the weaker demand environment, I think this may set the stage for further disappointments in the stock as the Q4 FY22 print comes out.
Technicals
If this is your first time reading a Hunting Alpha article using Technical Analysis, you may want to read this post, which explains how and why I read the charts the way I do, utilizing principles of Flow, Location and Trap.
Relative Read of FND vs S&P500
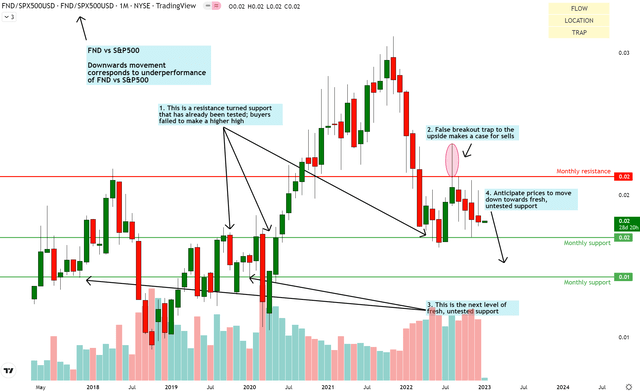
FND vs SPX500 Technical Analysis (TradingView, Author’s Analysis)
The relative chart of FND shows underperformance vs the S&P500 so far. This is unsurprising given the weak underlying demand drivers discussed earlier.
Regarding my future outlook, I believe a false breakout bull trap has validated the case for sells. I anticipate a move down below the immediate monthly support as that level is already tested and buyers have shown an inability to reverse the incumbent down flow. Therefore, I posit that prices need to go lower to create a genuine reversal of the trend.
Standalone Read of FND
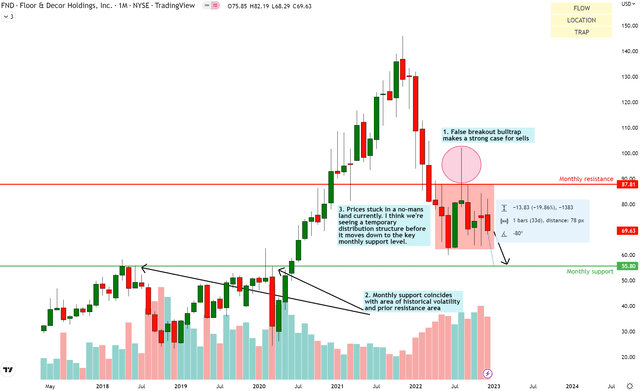
FND Technical Analysis (TradingView, Author’s Analysis)
The standalone chart of FND also shows a bull trap, which I believe makes a strong case for a bearish outlook. Prices have been consolidating in a range, but it does not appear to be happening at a very logical location with prior history. Hence, I think it is due for a move lower to the monthly support at $55.80. This would correspond to an almost 20{a57a8b399caa4911091be19c47013a92763fdea5dcb0fe03ef6810df8f2f239d} decline.
Takeaway & Positioning
Overall, I expect FND to lead to continue posting weak sales growth, and perhaps even disappoint the street’s expectations of $4.29bn on sales growth. The stock has underperformed the S&P500 and I don’t see much reasons for it to reverse this trend until underlying demand drivers such as home sales growth appreciate. On the technicals side, I anticipate FND to underperform vs the S&P500 and also fall on an absolute basis.
Hence, I am adopting a ‘sell’ stance on FND.
Bear View Considerations
Here are some key considerations if you choose to actively play a bearish view:
Short Interest
The stock currently has a 12.44{a57a8b399caa4911091be19c47013a92763fdea5dcb0fe03ef6810df8f2f239d} short interest as a {a57a8b399caa4911091be19c47013a92763fdea5dcb0fe03ef6810df8f2f239d} of float. This is a moderate number. One needs to be very careful of short squeeze risks. I assess this risk to be low to moderate, but that’s just because I am quite conservative.
Borrowing Costs
Latest data from Fintel shows a 0.29{a57a8b399caa4911091be19c47013a92763fdea5dcb0fe03ef6810df8f2f239d} annual borrowing cost for shorting shares of FND.
Duration of Potential Short Trade
My thesis would be realized and over after the company’s Q4 FY22 or FY22 results release, which is currently estimated to be on Feb 21 2023.
Risks
A convincing, surprise beat in FND’s Q4 FY22 sales will be a trigger for a higher share price. But that is a risk that happens on final judgement day for my thesis.
As we move towards the Q4 FY22 results, I suspect the market will be watching US existing home sales growth figures as a key barometer to ascertain FND’s outlook. Hence, the release of December 2022’s figures, which will indicate the complete picture for the full Q4 FY22 quarter will be a key monitorable checkpoint. This data release is expected on January 20 2023 at 10am ET.
The lens through which I am viewing this upcoming release would be how it performs vs consensus estimates. If US existing home sales prints below consensus expectations, then that should support a bearish thesis on FND. If, on the other hand, there is a material beat on the December 2022 numbers, then the outlook on FND’s Q4 FY22 sales would look incrementally better, which may prompt a thesis review, or at the very least, a pruning of a bearish bet.
